
By Kent E. Fillinger
September is a prime time for churches to start planning next year’s budget, as most use a calendar year (January to December) budget cycle. To assist in your church’s budget projections, I’ll share some statistics and summaries on giving and debt from our 2018 church survey.
Among church leaders, there are two distinct schools of thought about debt. Some are anti-debt and make being debt-free a primary goal of their church, while others see debt as a strategic tool to help finance the church’s vision. Whatever your thoughts, my hope is this data will help guide your thinking and decisions with regard to financing the vision and mission of your church.
“Money follows vision” is an old adage. Here is a newer one: “Debt follows church growth.” Our annual surveys consistently show that larger churches are more likely to have debt. For example, in 2018, 92 percent of megachurches had debt compared with only 11 percent of very small churches.

The total reported debt load in 2018 for the 425 churches surveyed was $849,301,519. The average debt for megachurches was more than $9.1 million compared to only $111,600 for the handful of very small churches with debt.
It’s interesting to note, however, that megachurches and very small churches have similar levels of debt per worship attendee ($2,021 and $1,800, respectively). Small churches had the highest level of debt per worship attendee ($4,680), followed by emerging megachurches ($3,277).

How Does Debt Affect Church Growth and Baptism Ratios?
I was curious what impact, if any, a church’s debt and total giving has on its growth rate and baptism ratio (the number of people baptized per 100 in attendance).
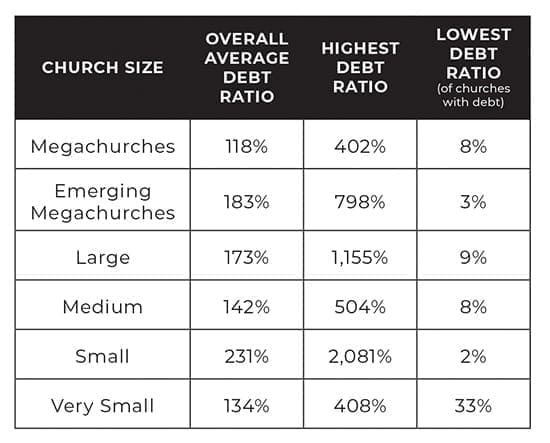
First, I examined the debt ratio for each church, as determined by total reported income for 2018 compared with total debt. At 231 percent, small churches had the highest debt ratio, meaning the average small church with debt had a total debt load just over 2.3 times their total giving in 2018. At 118 percent, megachurches had the lowest debt ratio.
Next, I looked for a possible interrelationship between debt levels and average growth rates and baptism ratios. (Only five very small churches had debt, so those churches were excluded from the summary below.)
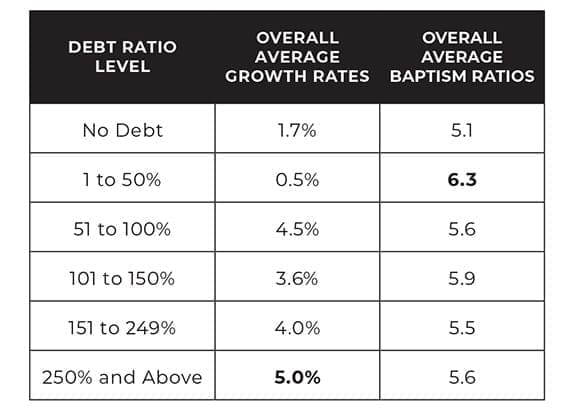
The one-year snapshot shows that, regardless of size, churches with the highest debt ratio (250 percent or more—that is, 2.5 times or more than their total income in 2018) grew faster than churches with lower debt ratios.
It’s interesting to note, churches with the lowest debt ratio level (1 to 50 percent) and those with no debt had the slowest growth rates (0.5 percent and 1.7 percent, respectively).
No such pattern emerged with baptism ratios. Churches with debt ratios of 1 to 50 percent had a 6.3 baptism ratio, highest among the six categories. Baptism ratios were similar from one debt ratio level to the next, but growth rates were not.
I also studied church debt ratio for possible impact on giving compared to budget in 2018. Churches with lower debt ratios were more likely to see their giving “exceed” budget than churches with higher debt ratios.
Churches that reported their giving “exceeded” budget had an average debt ratio of 122 percent. Churches that reported giving “met” budget last year had a debt ratio of 165 percent. But churches that reported giving “fell short” of their proposed budget had a debt ratio of 210 percent.
How Many Weeks of Reserve Funds Do Churches Have?
Darren Key, CEO of Christian Financial Resources, strongly recommends that church leaders know how many weeks of cash on hand their church has. He suggests that every church keep a minimum of 13 weeks of cash on hand, with 2 to 4 weeks held in a checking account and the remainder in an interest-bearing savings account.
For the first time, we asked churches, “Approximately how many weeks’ worth of operating expenses does your church generally keep on hand in cash reserves?”

Churches reported having an average of 9.7 weeks of cash reserves, well below the recommended target of 13 weeks. With 13.8 weeks of cash reserves, very small churches were the only category of churches to meet the target. Megachurches had the lowest level of cash reserves, 7.8 weeks on average.
A correlation exists between church spending and the number of weeks of cash reserves. Churches that reported “increasing” ministry spending in 2018 had the most weeks of cash on hand—10.4 weeks. Churches that reported spending the “same” amount of money on ministry in 2017 and 2018 had 10.1 weeks of cash on hand. Churches that “decreased” ministry spending last year had the lowest level of cash reserves—7.9 weeks.
Similarly, churches that saw giving “exceed” their budget in 2018 had the highest level of cash reserves (10.8 weeks), compared with churches “meeting” their budget (9.5 weeks of cash on hand) and churches that “fell short” (8.6 weeks).
Conclusion
Here are some important questions to consider as your church leadership team reviews 2019 giving and prepares the 2020 ministry budget:
- Where do we fall on the debt spectrum as a leadership team? (Do we view being debt-free as a primary goal or do we view debt as a strategic tool?)
- What is our current debt ratio?
- What percentage of the total annual budget did we spend on debt service this year?
- Would refinancing our loan help us save money?
- How can we be better managers of the resources God has given our church?
- How many weeks of cash reserves do we have available?
- How can we adjust our ministry spending to reach the suggested goal of 13 weeks of cash reserves?
- Should we transfer more of our operational reserves into an interest-bearing savings account?
Kent E. Fillinger serves as president of 3:STRANDS Consulting, Indianapolis, Indiana, and regional vice president (Ohio, Pennsylvania, Michigan) with Christian Financial Resources.

Author: Kent E. Fillinger
Kent E. Fillinger serves as president of 3:STRANDS Consulting, Indianapolis, Indiana, and regional vice president (Ohio, Pennsylvania, Michigan) with Christian Financial Resources.


Very interesting read as a financial coach. How can a church effectively lead their flock with how to deal with money if they cannot manage it themselves.
I really enjoyed reading this article today. I’d be very interested to read some updated numbers now that COVID has rocked the church scene and in-person attendance. I also found it ironic to think about the church cash reserves as this was written right before COVID when so many would have needed those reserves to keep their doors opened when churches were not meeting in person. Very interesting research. Great job!