By Kent E. Fillinger
When I look back at the last few years through the filter of our annual survey results, I would argue that 2020 was a year of crisis, 2021 was a year of adaptation, and 2022 was a year of transition.
In-Person vs. Online Worship Attendance
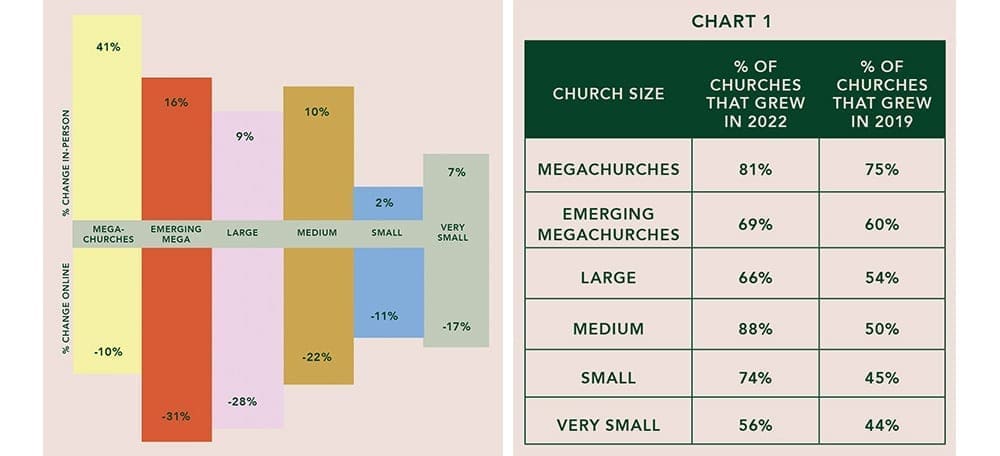
One exciting transition churches experienced last year was more people shifted back to in-person worship from watching online. Comparing 2022 in-person worship attendance data to 2021 showed attendance increases for churches of all sizes. The megachurches (with average weekly worship attendance of 2,000 or more) suffered the greatest attendance declines during the COVID-19 pandemic that arrived in March 2020. But the megachurches in our study experienced the strongest bounce back in attendance during 2022, with an average in-person attendance increase of 41 percent—from 2,653 to 3,747.
Overall, in-person weekly attendance for the 370 churches that participated in our study increased from 180,362 in 2021 to 239,864 last year, an increase of 33 percent. The overall average in-person attendance for these churches in 2021 was 496 and in 2022 was 648—an increase of 31 percent year over year.
The in-person worship attendance growth was partially offset by a declining number of online worshippers. Online viewership decreased for churches of all sizes. Emerging megachurches (which average 1,000 to 1,999 in weekly worship attendance) experienced a 31 percent drop in that metric, the largest percentage decline in online worshippers of any church size category. Overall, the average number of online viewers for churches in our study fell from 669 weekly in 2021 to 430 last year, a 36 percent decrease. The total number of online viewers declined by 12 percent, from 139,470 to 123,444.
As the effects from the pandemic continue to fade, it will be interesting to see if these attendance trends continue. Almost one-fourth of the churches (22 percent) in this year’s survey did not report any online attendance figures. Only 5 percent of the 370 churches reported online attendance numbers that exceeded their in-person worship attendance in 2022.
Among megachurches, 22 percent saw more online worshippers than in-person worshippers, the largest percentage among any church size category. Next came the large churches (averaging 500 to 999 weekly) with 7 percent.
Overall, our survey found 78 percent of people worshipped in-person last year compared with 22 percent online.
Very small churches (averaging 99 or fewer worshippers) had the highest percentage of weekly in-person attendees, 89 percent, followed by medium size churches (averaging 250 to 499 weekly), 85 percent. Megachurches had the smallest percentage of total in-person attendees, 59 percent.
Growth Analysis
The churches in our survey reported record growth rates last year. Overall, these churches grew an average of 12.8 percent in 2022. Small churches (averaging 100 to 249 in weekly worship attendance) reported 13.6 percent growth last year, the highest in our survey, followed by megachurches at 13.4 percent. Emerging megachurches had the lowest growth rate, a still robust 10.3 percent.
To provide context, in the past, no category of churches had exceeded a 7 percent annual growth rate in almost two decades of tracking.
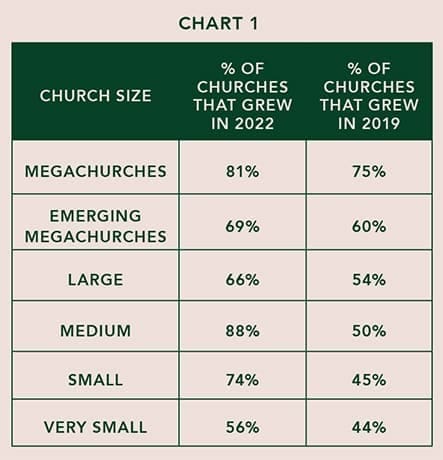
A higher percentage of churches in each size category grew from 2021 to 2022 than from 2018 to 2019 (the last “normal” year)—see Chart 1.
Another positive—all six church size categories grew from 2019 to 2022. On average, megachurches in our survey grew 28.3 percent from 2019 to 2022, an average of 9.4 percent per year. The very small churches in this year’s survey grew the slowest at 1 percent over that same time span. The overall average growth rate from 2019 to 2022 for these churches was 11.4 percent, which equates to 3.8 percent per year, which is comparable to historical annual growth rates.
It’s encouraging that the pandemic did not negatively impact church attendance over the long haul and that these churches, in fact, managed to grow during a challenging time.
Bottom Line on Baptisms
The number of baptisms in our churches continued a slow recovery from what was reported in 2019. To illuminate, the 50 megachurches in our 2019 survey baptized more people that year than all 370 churches in 2022—20,897 vs. 19,574, respectively.
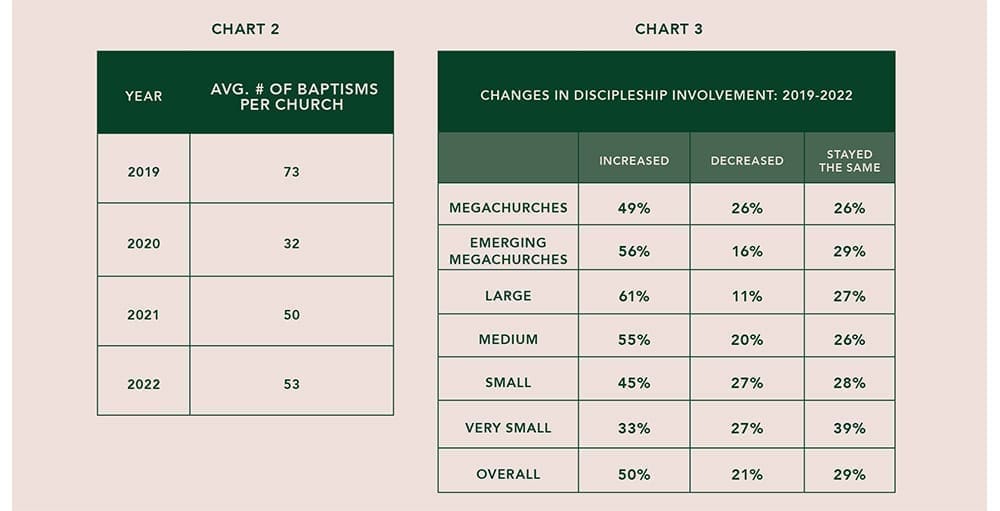
In 2019, the 439 reporting churches recorded 32,139 baptisms, for an average of 73 baptisms per church. The number of baptisms plummeted in 2020 (when most churches ceased public gatherings for weeks and months) to a total of 13,502 baptisms in 421 churches—an average of 32 baptisms per church. Baptisms rebounded some in 2021, as more people returned to in-person worship. The 412 churches in our 2021 survey reported 20,387 baptisms—an average of 50 per church. And in 2022, the average number of baptisms inched up again to 53 per church—19,574 baptisms in 370 churches.
Therefore, the average number of baptisms per church increased by 7 percent in 2022 compared with the year prior, but it was still 28 percent lower than the pre-pandemic numbers in 2019.
<<ABBY, Can you create and display a simple bar chart that shows the avg. # of baptisms per church over these four years? 2019—73; 2020—32; 2021—50; 2022—53>>
The number of baptisms doesn’t correspond to the strong growth rates recorded over the last one to three years. An optimist might argue we are on the verge of a surge in baptisms as new attendees continue to hear the gospel in these churches. But a pessimist might counter that attendance growth possibly was driven by transfers, as people decided to leave their former church during or after the pandemic. Perhaps it’s a combination of the two.
Church Engagement Trends
Christian Standard wanted to better assess the impact COVID-19 had on church life and engagement beyond attendance, baptisms, and giving. To that end, we asked churches a series of first-time questions to identify whether the level of adult participation in discipleship, service, and special events had increased, decreased, or stayed the same from 2019 to 2022. The survey also explored whether opportunities made available by churches in these areas had grown, shrunk, or remained about the same post-pandemic.
The survey asked, “Comparing 2019 (Pre-COVID) to 2022, did the percentage of adults involved in small groups, classes, or other discipleship opportunities increase, decrease, or stay the same.” Chart 3 shows the results.
A survey question also asked, “Comparing 2019 (Pre-COVID) to 2022, did the number of opportunities the church provided for small groups, classes, or other discipleship opportunities increase, decrease, or stay about the same?”
Overall, almost half of the churches (49 percent) said the opportunities for spiritual growth increased over the last few years, with emerging megachurches (60 percent) leading the way in this category. Very small churches were the least likely to have increased their number of growth and discipleship opportunities, with only 26 percent reporting an increase.
The number of discipleship opportunities offered stayed about the same from 2019 to 2022 in 36 percent of the churches surveyed. The most stable in this regard were the very small churches with 46 percent reporting they maintained the same number of growth opportunities. Among the other five church size categories, “about the same” was the response from 30 to 36 percent of churches.
Only 15 percent of the churches said they decreased the number of discipleship opportunities during that span. Just over one-fourth of very small churches (28 percent) decreased the number of growth options, which was the largest percentage tallied. Emerging megachurches were the least likely to have cut discipleship opportunities, with only 4 percent doing so.
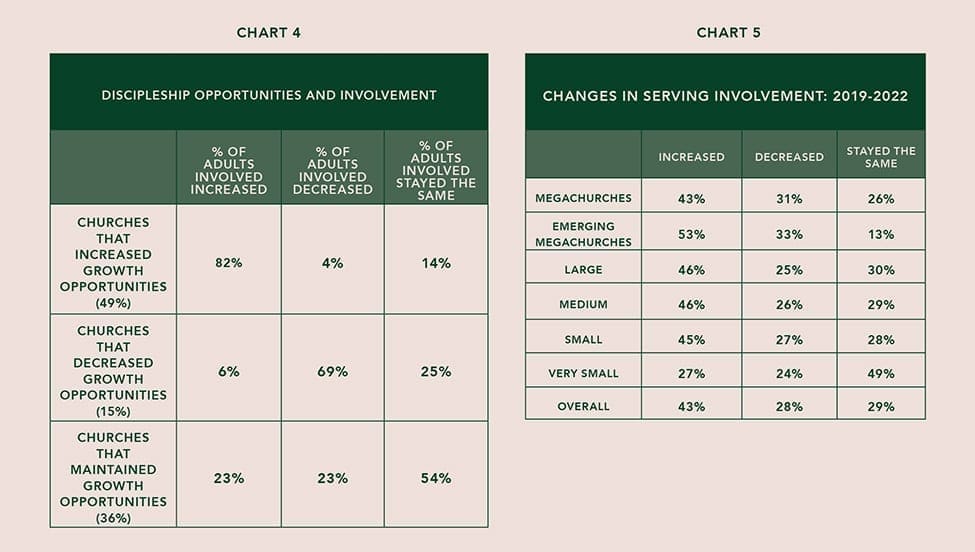
The next chart shows data that combines information gleaned in the responses to the first two questions. For example, 82 percent of the churches that increased the number of growth opportunities also experienced an increase in the percentage of adults involved.
Several years ago, the “Simple Church” movement advocated reducing the number of growth options available to increase participation, the theory being that “less is more.” Our survey responses challenged this ministry strategy by showing that sometimes “less is less.” For example, just over two-thirds (69 percent) of the churches that “decreased their spiritual growth opportunities” also saw a decrease in the percentage of adults involved from 2019 to 2022.
Ministry Involvement Trends
We also wanted to gauge what impact, if any, COVID-19 had on people serving and volunteering for ministries inside or outside the church.
The survey asked, “Comparing 2019 (Pre-COVID) to 2022, did the percentage of adults involved in serving, either inside or outside the church, increase, decrease, or stay about the same.” Here are the results.
A survey question also asked, “Comparing 2019 (Pre-COVID) to 2022, did the number of opportunities the church provided for serving, either inside or outside the church, increase, decrease, or stay about the same.”
Almost half the churches (49 percent) surveyed said they increased service opportunities, while 38 percent said the number of volunteer opportunities “stayed about the same,” and only 13 percent said such opportunities decreased from 2019 to 2022.
Megachurches were the most likely to increase serving opportunities and the least likely to decrease them (56 percent vs. 3 percent, respectively). Very small churches were the least likely to increase serving options and the most likely to have kept the number of ministry opportunities the same (30 percent vs. 50 percent, respectively). More than one-fifth of the small churches (22 percent) said they “decreased” the number of serving options from 2019 to 2022, which was the highest percentage among all church size categories.
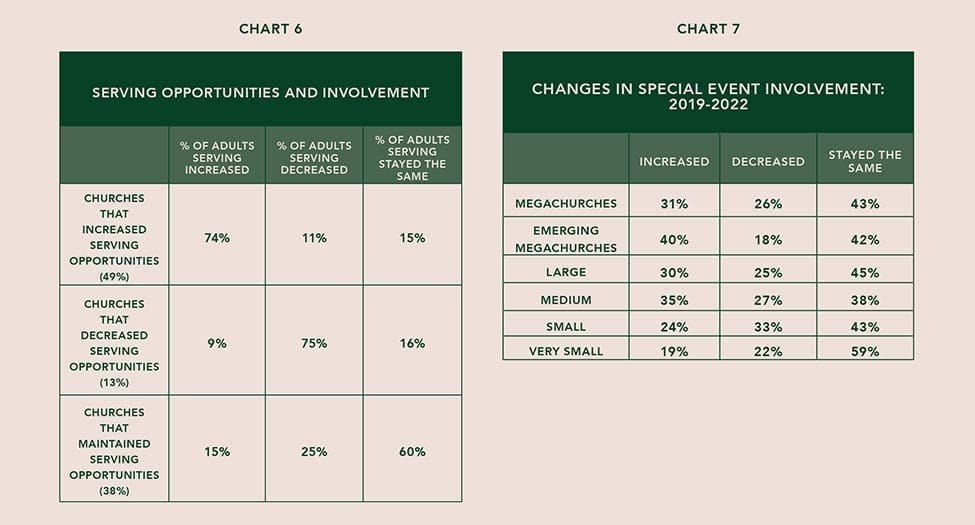
Chart 6 shows the impact of changes that churches made in increasing or decreasing the number of serving opportunities they made available.
Seventy-four percent of the churches that increased serving opportunities had an increase in the percentage of adults involved in volunteering. Likewise, three-fourths of the churches that decreased the number of serving options experienced a decrease in the percentage of adults serving.
Special Event Trends
To assess how the pandemic affected the number of special events churches offered, we asked, “Comparing 2019 (Pre-COVID) to 2022, did the percentage of adults involved in special events (such as marriage conferences, men’s or women’s conferences, prayer events, revivals, etc.) at your church increase, decrease, or stay about the same.” This chart shows the responses.
A survey question also asked, “Comparing 2019 (Pre-COVID) to 2022, did the number of opportunities the church provided for special events (such as marriage conferences, men’s or women’s conferences, prayer events, revivals, etc.) increase, decrease, or stay about the same.”
Almost half the churches (49 percent) reported the number of special events remained “about the same,” while just over one-fourth (28 percent) increased the number of such opportunities, and 24 percent decreased the number of special events offered over that span.
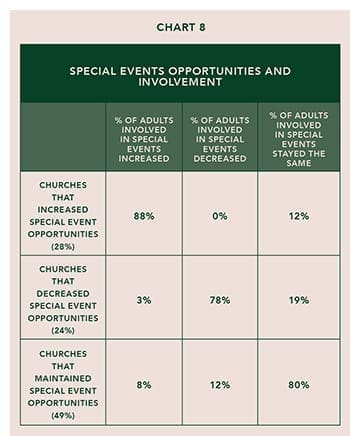
Chart 8 shows the impact of these actions in terms of the percentage of adults involved in special events.
Financial Snapshot
Giving continued a positive three-year trend as 77 percent of churches reported that their total income during the most recent fiscal year met or exceeded the previous fiscal year. Almost one-third of the churches (30 percent) reported giving was up 1 to 9 percent in the most recent fiscal year. This illustrates the faithfulness of God’s people to give and be generous during a pandemic and beyond.

Author: Christian Standard
Contact us at **@********************ia.com