By Kent E. Fillinger
Christian author Randy Alcorn said, “God sees our finances and our faith as inseparable.” Jesus said, “For where your treasure is, there your heart will be also” (Matthew 6:21). Examining the financial picture of churches provides insights into the faith and focus of some of the churches in our movement. This deep dive is designed to help identify trends and enable your church to better evaluate its financial situation.
Church Giving vs. Inflation
When the COVID-19 pandemic struck four years ago, most church leaders were concerned that closing in-person services would negatively affect giving. It’s been encouraging, though, to see positive giving trends reported for most of the churches we’ve surveyed the last several years.
In 2023, this trend continued as 57 percent of the churches reported their giving exceeded their budget, with 21 percent of churches saying giving met their budgeted needs. Thus, only 22 percent of churches we surveyed experienced a giving shortfall compared to their budget expectations.
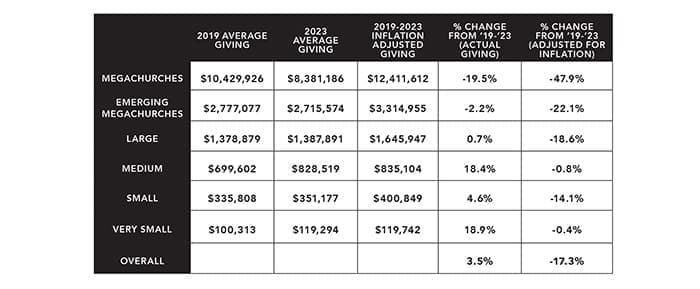
More than $500 million total was given at the 296 churches that reported their offering statistics, for an average of $1.8 million per church. While the churches we’ve surveyed have reported positive giving since 2020, I wanted to see how pre-pandemic giving in 2019 compared to last year’s giving, when adjusted for inflation. The chart below shows what church giving in 2019 would have been in 2023, based on inflation adjusted dollars (using the Bureau of Labor Statistics’ CPI Inflation Calculator).
While the actual average dollar amounts given in each size category were up slightly (3.5 percent overall) from 2019 to 2023, the actual “buying power” of those dollars, when adjusted for inflation, suffered an overall decline of 17.3 percent.
Larger churches felt the biggest impact based on inflation-adjusted giving, while medium size and very small churches fared the best with their average giving almost keeping pace with inflation from 2019 to 2023.
Sources of Giving
Overall, 40 percent of giving was received electronically (online, text-to-give, giving app, kiosk, etc.). Megachurches led the way with 68 percent of giving received electronically. Very small churches had the smallest percentage of electronic giving, 9 percent.
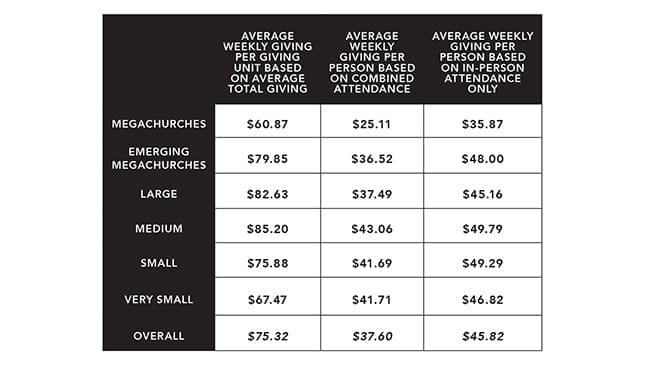
Our 2023 survey asked churches to report the number of “giving units” who support the church. For example, a family of four who gives to their church would be one giving unit. Comparing the number of giving units to the combined average worship attendance showed that overall, there was one giving unit for every two worship attendees.
The chart below shows the average weekly giving for each church size category based on giving units and also on combined and in-person-only average worship attendance. Average giving was the strongest in our medium churches and the weakest in our megachurches in 2023.
The Difference Debt Makes
Overall, half of the churches surveyed were debt-free in 2023. The total indebtedness for the other half of churches was $517,662,817, an average debt load of $3,863,155 per church. Megachurches were the most likely to report having debt (77 percent). Very small churches had the smallest percentage of churches with debt (11 percent). The spectrum of total indebtedness for individual churches ranged from $51,000 to $30 million.
When calculating average debt per worship attendee (in-person and online) for each size category of churches, megachurches had the smallest average per-person debt: $2,915 of debt per attendee. Very small churches had the largest average per-person debt: $7,369 of debt per attendee.
On average, the overall current debt load for the churches reporting was 1.9 times their average annual giving. This means it would take almost two years’ worth of a church’s giving to pay off their existing debt.
By comparison, the average debt load of the 355 churches surveyed in The Unstuck Church Report (Q1 2024) was 0.7 times the church’s annual giving. The handful of very small churches in our survey had the highest debt-to-annual-giving ratio with 3.6. Medium churches had the lowest such ratio with 1.3.
Overall, the churches with debt grew faster and had a higher baptism ratio than the debt-free churches. Churches with debt grew an average 17.5 percent in 2023 compared to 14.6 percent for the churches with no debt. Additionally, churches with debt had an overall average baptism ratio (number of baptisms per 100 people in attendance) of 6.8, while churches without debt had an average baptism ratio of 5.7.
It’s worth noting, churches with a debt-to-annual-giving ratio of 2.9 or less predominantly had the best growth rates and baptism ratios. So, it appears that when churches cross the debt threshold of three times or more of their annual giving, then the weight of that additional debt can stifle attendance growth and reduce the baptism ratio.
Cash Reserves
Our 2023 survey also asked, “Approximately how many weeks’ worth of operating expenses does your church currently have on hand in cash reserves?” In the past, this question included pre-populated answer options with “21 weeks or more” as the maximum option. The answer box was open-ended for the 2023 survey, which allowed churches to report their actual number of weeks of cash reserves beyond 21 weeks.
Overall, the 292 churches that answered this question reported they had an average of 30 weeks of cash reserves. By comparison, churches in The Unstuck Church Report reported having 19 weeks of cash reserves.
Very small churches in our survey had the most weeks of cash reserves (an average of 49 weeks) while megachurches had the fewest weeks (an average of 19 weeks). Financial experts recommend churches keep 13 weeks of cash reserves to provide the margin needed to handle financial challenges or giving shortfalls. Overall, almost a third (29.5 percent) of the churches in our survey reported having 12 weeks or less of cash reserves.

Author: Christian Standard
Contact us at **@********************ia.com